
Fixing a Broken Metric for UX Copy Localization
Fixing a Broken Metric for UX Copy Localization
Fixing a Broken Metric for UX Copy Localization
AliExpress Web & App
AliExpress Web & App
AliExpress Web & App
Product Designer
Product Designer
Product Designer
User Research, Localization Strategy, Data Analysis
User Research, Localization Strategy, Data Analysis
Team
Team
Team
Product Designer
Content Strategists
UX Writers
Engineers
Business Strategists
Product Designer
Content Strategists
UX Writers
Engineers
Business Strategists
Duration
Duration
Duration
1 year
Mar 2022 - Mar 2023
1 year
Mar 2022 - Mar 2023
Tools
Tools
Tools
Alibaba Survey Platform
Figma/Sketch
Excel
Alibaba Survey Platform
Figma/Sketch
Excel
The Symptom
The Symptom
The Symptom
AliExpress's Gap Survey, the primary metric for UX content localization quality, lost credibility due to results inconsistent with internal evaluations.
AliExpress's Gap Survey, the primary metric for UX content localization quality, lost credibility due to results inconsistent with internal evaluations.
AliExpress's Gap Survey, the primary metric for UX content localization quality, lost credibility due to results inconsistent with internal evaluations.
The Problems
The Problems
The Problems
Branding and visual biases
Branding and visual biases
Branding and visual biases
Unfiltered low-fidelity survey data
Unfiltered low-fidelity survey data
Unfiltered low-fidelity survey data
Ambiguous rating scale
Ambiguous rating scale
Ambiguous rating scale
Our Solution
Our Solution
Our Solution
A revamped survey methodology that gathers reliable feedback through competitive comparison, bias control, and enhanced data validity.
A revamped survey methodology that gathers reliable feedback through competitive comparison, bias control, and enhanced data validity.
A revamped survey methodology that gathers reliable feedback through competitive comparison, bias control, and enhanced data validity.
The Impact
The Impact
The Impact

Filtered out 82.4% invalid responses
Filtered out 82.4% invalid responses
Filtered out 82.4% invalid responses

Gap (%) narrowed by 6.13 percentage points per market
Gap (%) narrowed by 6.13 percentage points per market
Gap (%) narrowed by 6.13 percentage points per market
THE CONTEXT
THE CONTEXT
THE CONTEXT
One frictionless experience for 18 languages
One frictionless experience for 18 languages
One frictionless experience for 18 languages
AliExpress is a global B2C e-commerce platform serving across 220+ markets in 18+ languages.
AliExpress is a global B2C e-commerce platform serving across 220+ markets in 18+ languages.
AliExpress is a global B2C e-commerce platform serving across 220+ markets in 18+ languages.
As a Product Designer on the Localization Team, I owned the end-to-end UX localization quality across all language markets in close partnerships with Content Strategists, UX Writers, Developers, and Business Strategists.
As a Product Designer on the Localization Team, I owned the end-to-end UX localization quality across all language markets in close partnerships with Content Strategists, UX Writers, Developers, and Business Strategists.
As a Product Designer on the Localization Team, I owned the end-to-end UX localization quality across all language markets in close partnerships with Content Strategists, UX Writers, Developers, and Business Strategists.
Our existing mechanism
Our existing mechanism
Our existing mechanism
Since June 2021, we had been relying on the Gap Survey (Customer Language Experience Survey) as our external KPI to quantify the localization level, complementing our internal linguistic evaluations.
Since June 2021, we had been relying on the Gap Survey (Customer Language Experience Survey) as our external KPI to quantify the localization level, complementing our internal linguistic evaluations.
Since June 2021, we had been relying on the Gap Survey (Customer Language Experience Survey) as our external KPI to quantify the localization level, complementing our internal linguistic evaluations.
After each major localization update, surveys were sent via email newsletters to track user experience across 5 core markets: US, Spain, France, Brazil, and Korea.
After each major localization update, surveys were sent via email newsletters to track user experience across 5 core markets: US, Spain, France, Brazil, and Korea.
After each major localization update, surveys were sent via email newsletters to track user experience across 5 core markets: US, Spain, France, Brazil, and Korea.
Users were asked to rate AliExpress’s language quality on a subjective clarity scale against a direct competitor in the respective market, and select reasons for negative ratings through predefined/open-ended responses.
Users were asked to rate AliExpress’s language quality on a subjective clarity scale against a direct competitor in the respective market, and select reasons for negative ratings through predefined/open-ended responses.
Users were asked to rate AliExpress’s language quality on a subjective clarity scale against a direct competitor in the respective market, and select reasons for negative ratings through predefined/open-ended responses.

Survey Question
Survey Question
Survey Question

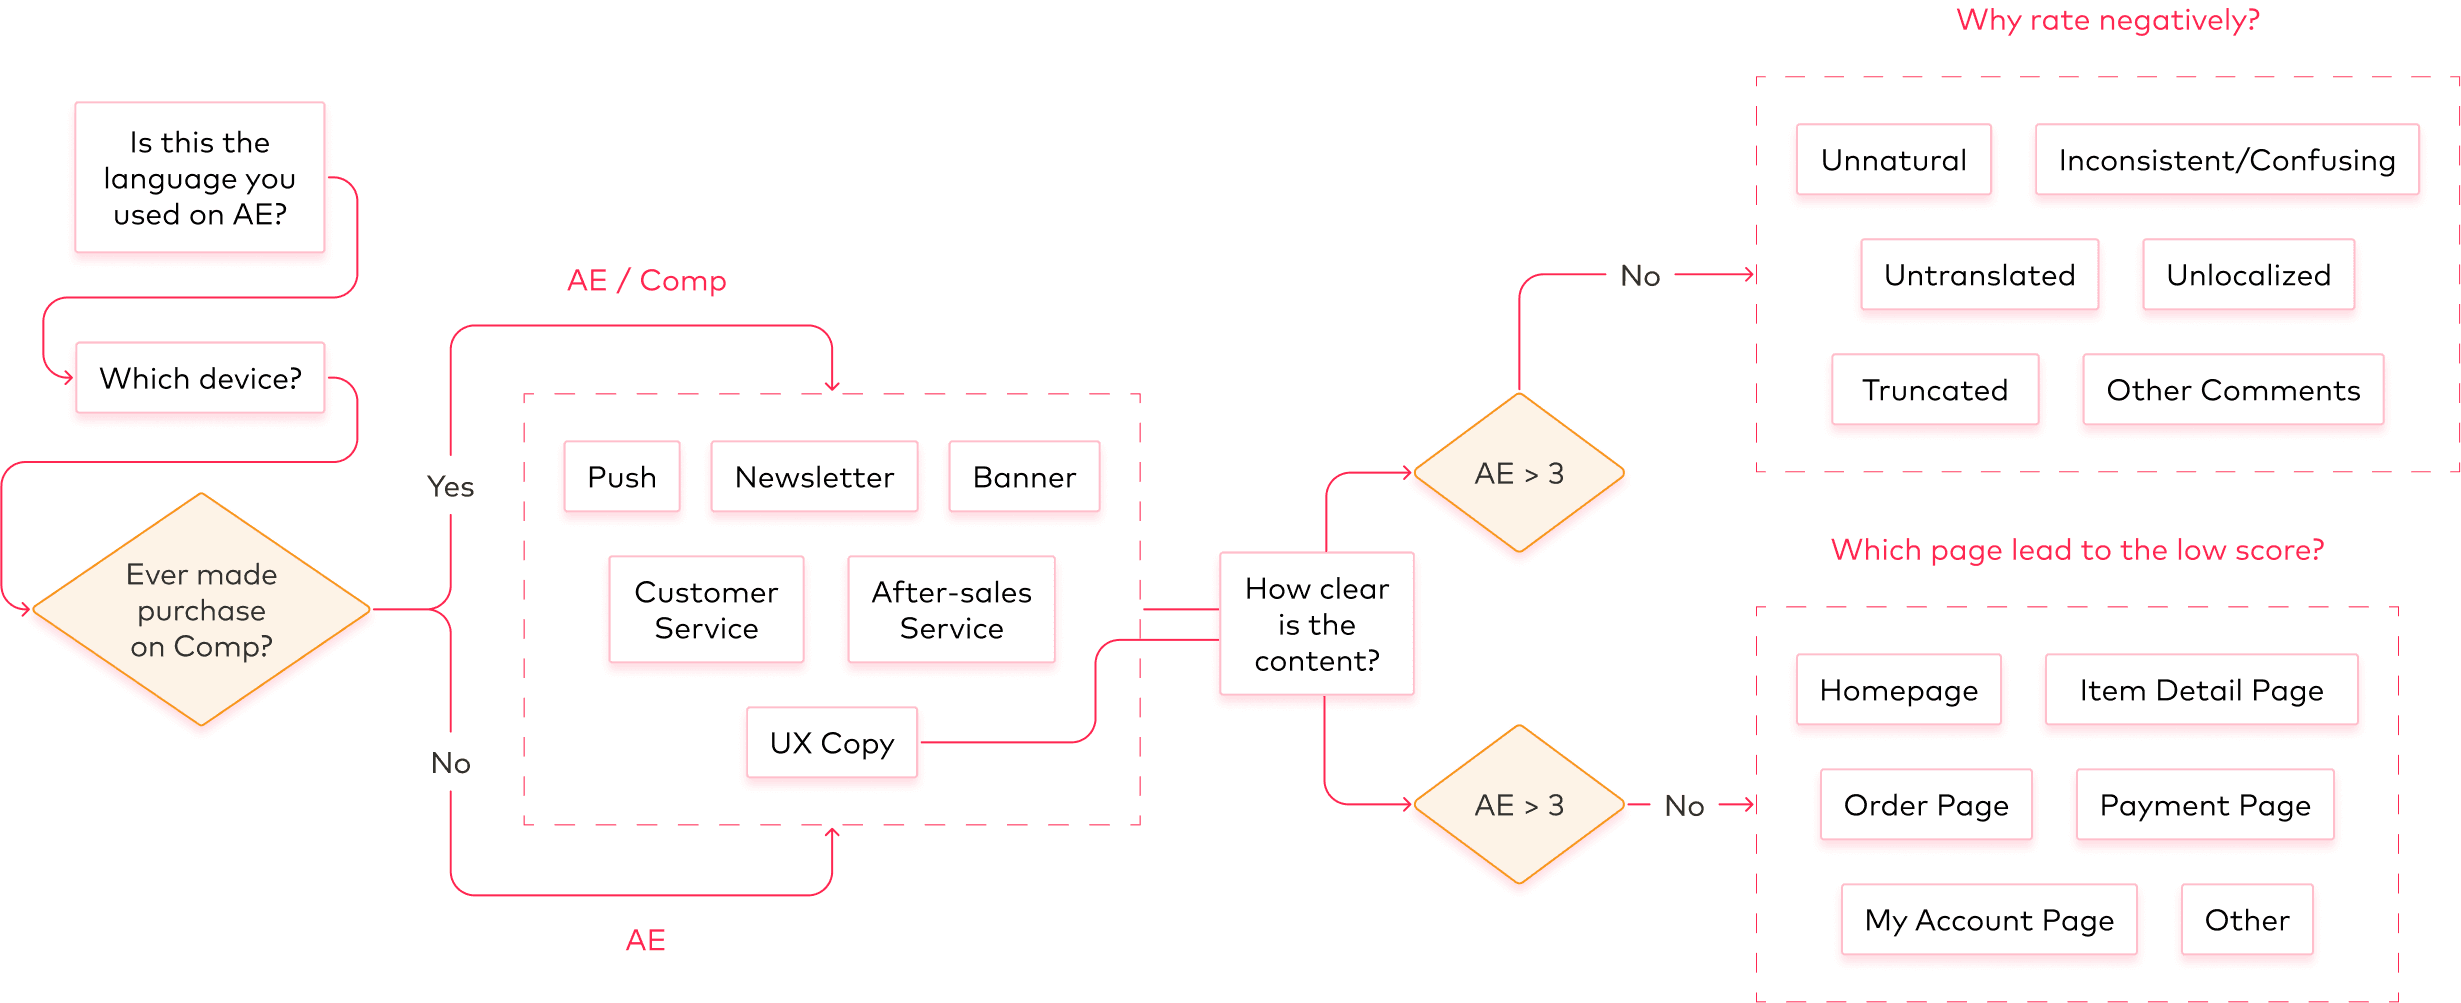
Survey Flow
Survey Flow
Survey Flow
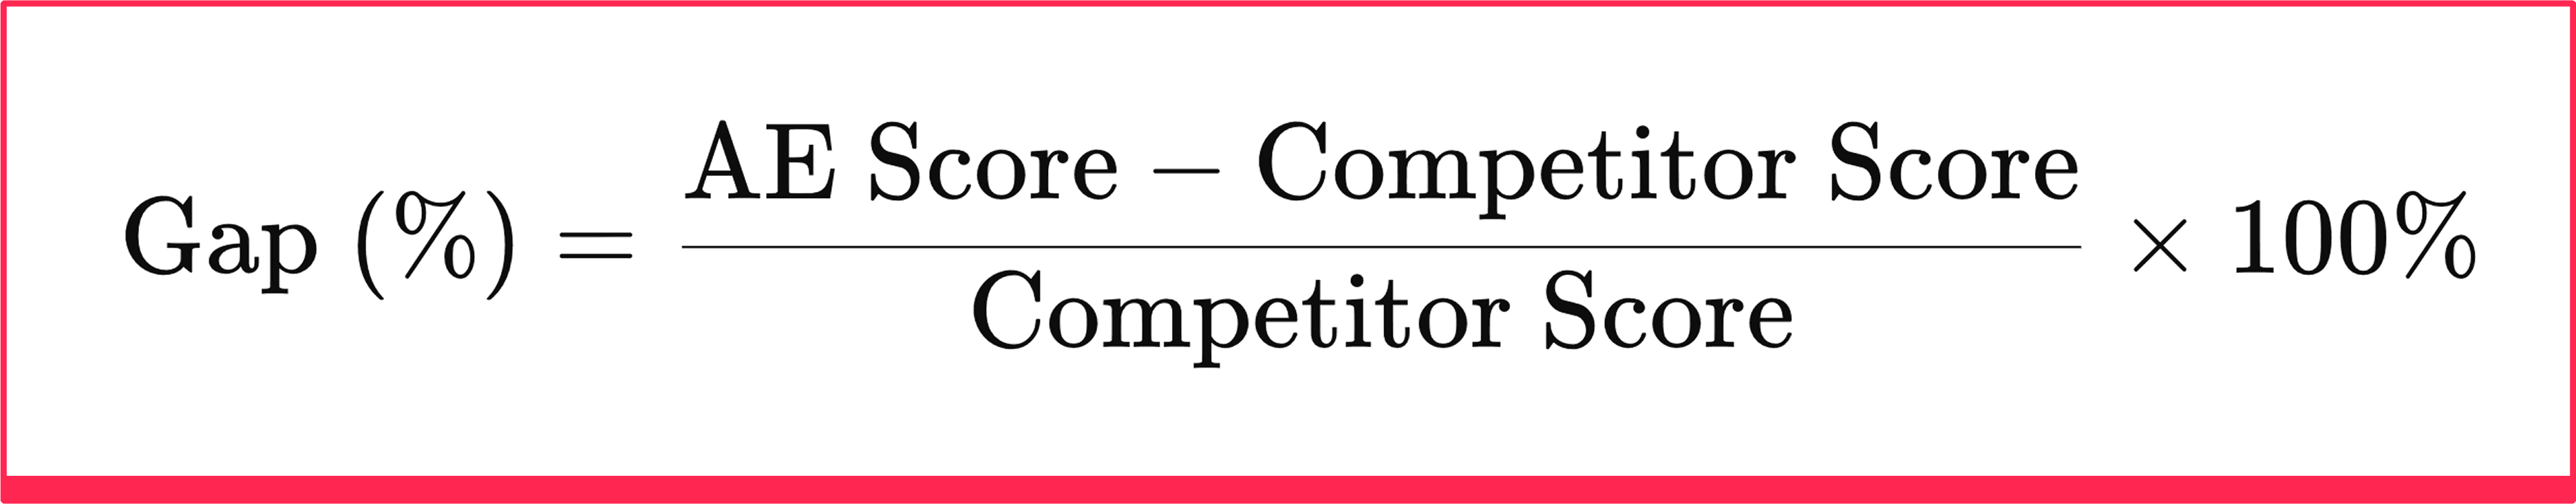
We take the percentage difference between AliExpress (AE) and our competitors (e.g. Amazon in US market) as the Gap (%) to benchmark localization performance.
We take the percentage difference between AliExpress (AE) and our competitors (e.g. Amazon in US market) as the Gap (%) to benchmark localization performance.
We take the percentage difference between AliExpress (AE) and our competitors (e.g. Amazon in US market) as the Gap (%) to benchmark localization performance.
Results stopped making sense
Results stopped making sense
Results stopped making sense
Over time, the survey results began to show wild fluctuations across rounds despite no significant changes to the online contents.
Over time, the survey results began to show wild fluctuations across rounds despite no significant changes to the online contents.
Over time, the survey results began to show wild fluctuations across rounds despite no significant changes to the online contents.
We decided to reexamine this flawed version and rebuild the metric to ensure it delivered trustworthy insights moving forward.
We decided to reexamine this flawed version and rebuild the metric to ensure it delivered trustworthy insights moving forward.
We decided to reexamine this flawed version and rebuild the metric to ensure it delivered trustworthy insights moving forward.
THE PROCESS
THE PROCESS
THE PROCESS
Fixing the metric step by step
Fixing the metric step by step
Fixing the metric step by step

ANATOMIZE
ANATOMIZE
ANATOMIZE
Why the metric was failing
Why the metric was failing
Why the metric was failing
A deep audit revealed 3 critical flaws that compromised its effectiveness:
A deep audit revealed 3 critical flaws that compromised its effectiveness:
A deep audit revealed 3 critical flaws that compromised its effectiveness:
Granularity Mismatch
Granularity Mismatch
Though content types were isolated in the questions, users rarely assessed language quality in such granularity.
Though content types were isolated in the questions, users rarely assessed language quality in such granularity.
Though content types were isolated in the questions, users rarely assessed language quality in such granularity.
Vague Rating Scale
Vague Rating Scale
Unclear definitions of “clarity” levels led to varied subjective interpretations, making their evaluations unreliable.
Unclear definitions of “clarity” levels led to varied subjective interpretations, making their evaluations unreliable.
Unclear definitions of “clarity” levels led to varied subjective interpretations, making their evaluations unreliable.
Data Contamination
Data Contamination
Open-ended responses revealed a proportion of users rated negatively based on issues like shipping delays, not copy quality.
Open-ended responses revealed a proportion of users rated negatively based on issues like shipping delays, not copy quality.
Open-ended responses revealed a proportion of users rated negatively based on issues like shipping delays, not copy quality.
STRATEGIZE & REDESIGN
STRATEGIZE & REDESIGN
STRATEGIZE & REDESIGN
1.0 A targeted revamp of the survey
1.0 A targeted revamp of the survey
1.0 A targeted revamp of the survey
To address the issues, we looked toward the Scorecard system, a method that has been used by internal Content Strategists to evaluate copy quality in context.
To address the issues, we looked toward the Scorecard system, a method that has been used by internal Content Strategists to evaluate copy quality in context.
To address the issues, we looked toward the Scorecard system, a method that has been used by internal Content Strategists to evaluate copy quality in context.
Unlike surveys with broad questions, Scorecard adopts a set of clearly defined criteria to assess content usability & voice across real product screens.
Unlike surveys with broad questions, Scorecard adopts a set of clearly defined criteria to assess content usability & voice across real product screens.
Unlike surveys with broad questions, Scorecard adopts a set of clearly defined criteria to assess content usability & voice across real product screens.
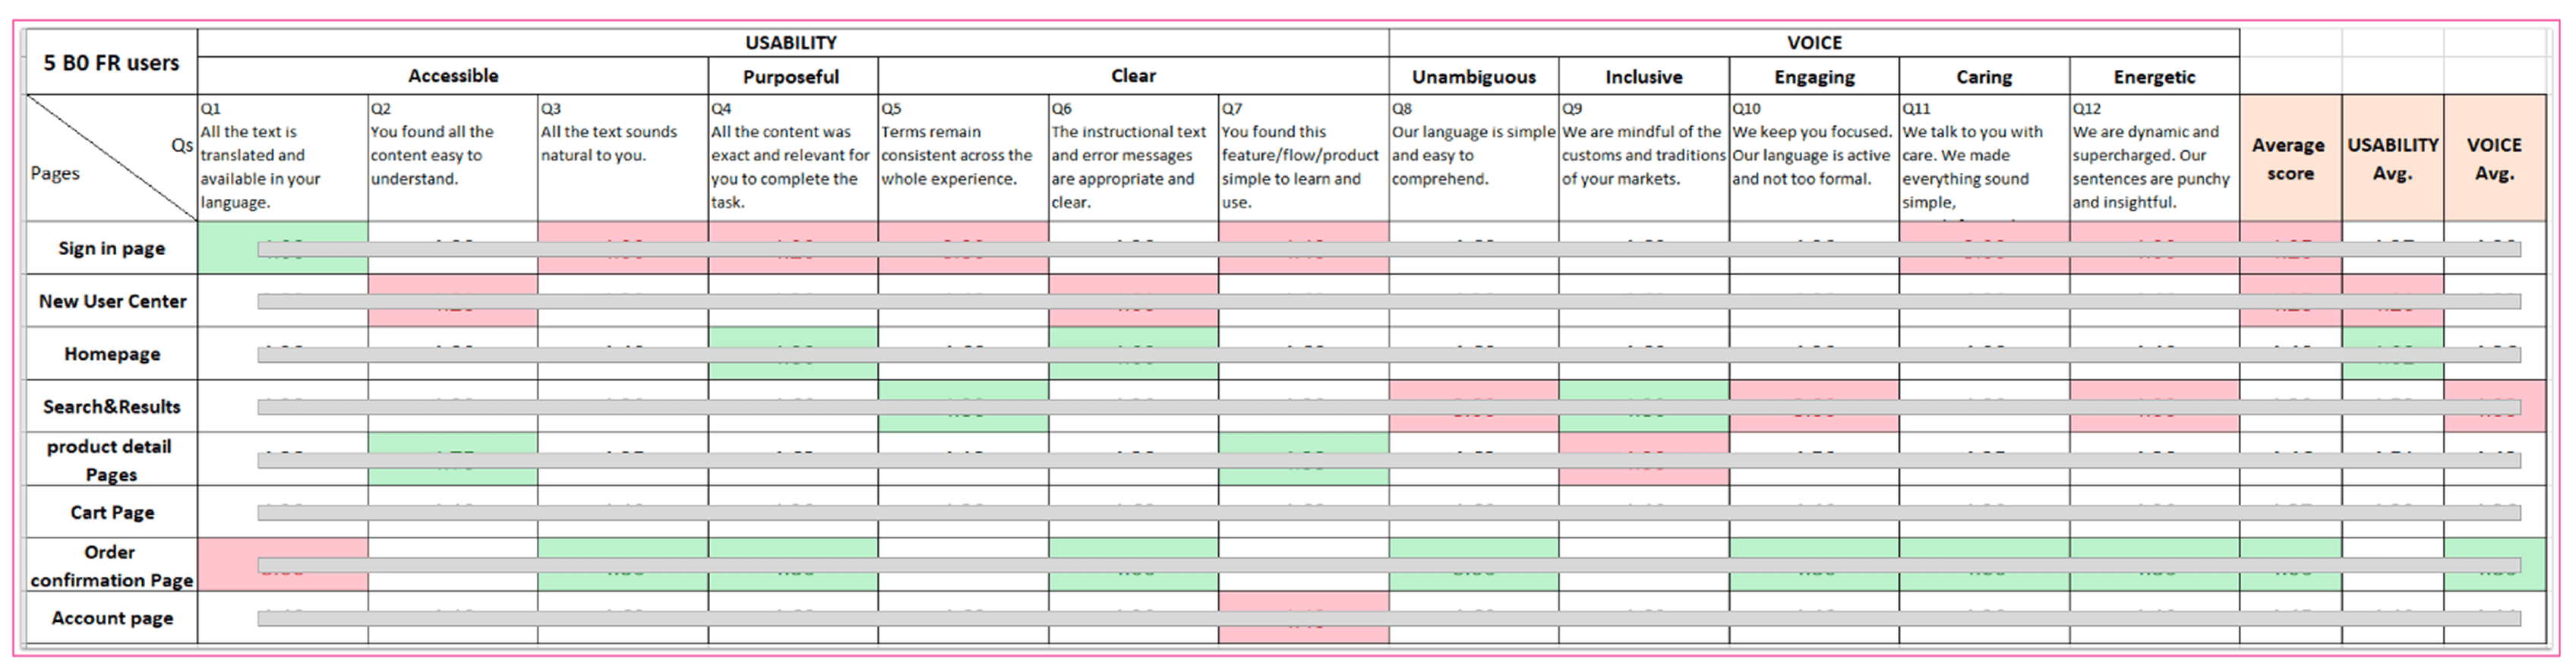
Scorecard Methodology
Scorecard Methodology
Scorecard Methodology
We saw Scorecard’s data traceability as a promising foundation, and revamped the Gap Survey into a hybrid method: retaining the scalability of surveys while improving contextual and benchmarking clarity.
We saw Scorecard’s data traceability as a promising foundation, and revamped the Gap Survey into a hybrid method: retaining the scalability of surveys while improving contextual and benchmarking clarity.
We saw Scorecard’s data traceability as a promising foundation, and revamped the Gap Survey into a hybrid method: retaining the scalability of surveys while improving contextual and benchmarking clarity.
Our goal was to create a version that minimized bias and yielded interpretable results.
Our goal was to create a version that minimized bias and yielded interpretable results.
Our goal was to create a version that minimized bias and yielded interpretable results.

Highlights of redesigns
Highlights of redesigns
A. Controlled Scope via Visual Aids
A. Controlled Scope via Visual Aids
Instead of naming a general scope, we used targeted screenshots to anchor user attention on specific language elements. Out-of-scope areas were masked in gray to reduce distractions.
Instead of naming a general scope, we used targeted screenshots to anchor user attention on specific language elements. Out-of-scope areas were masked in gray to reduce distractions.
Instead of naming a general scope, we used targeted screenshots to anchor user attention on specific language elements. Out-of-scope areas were masked in gray to reduce distractions.
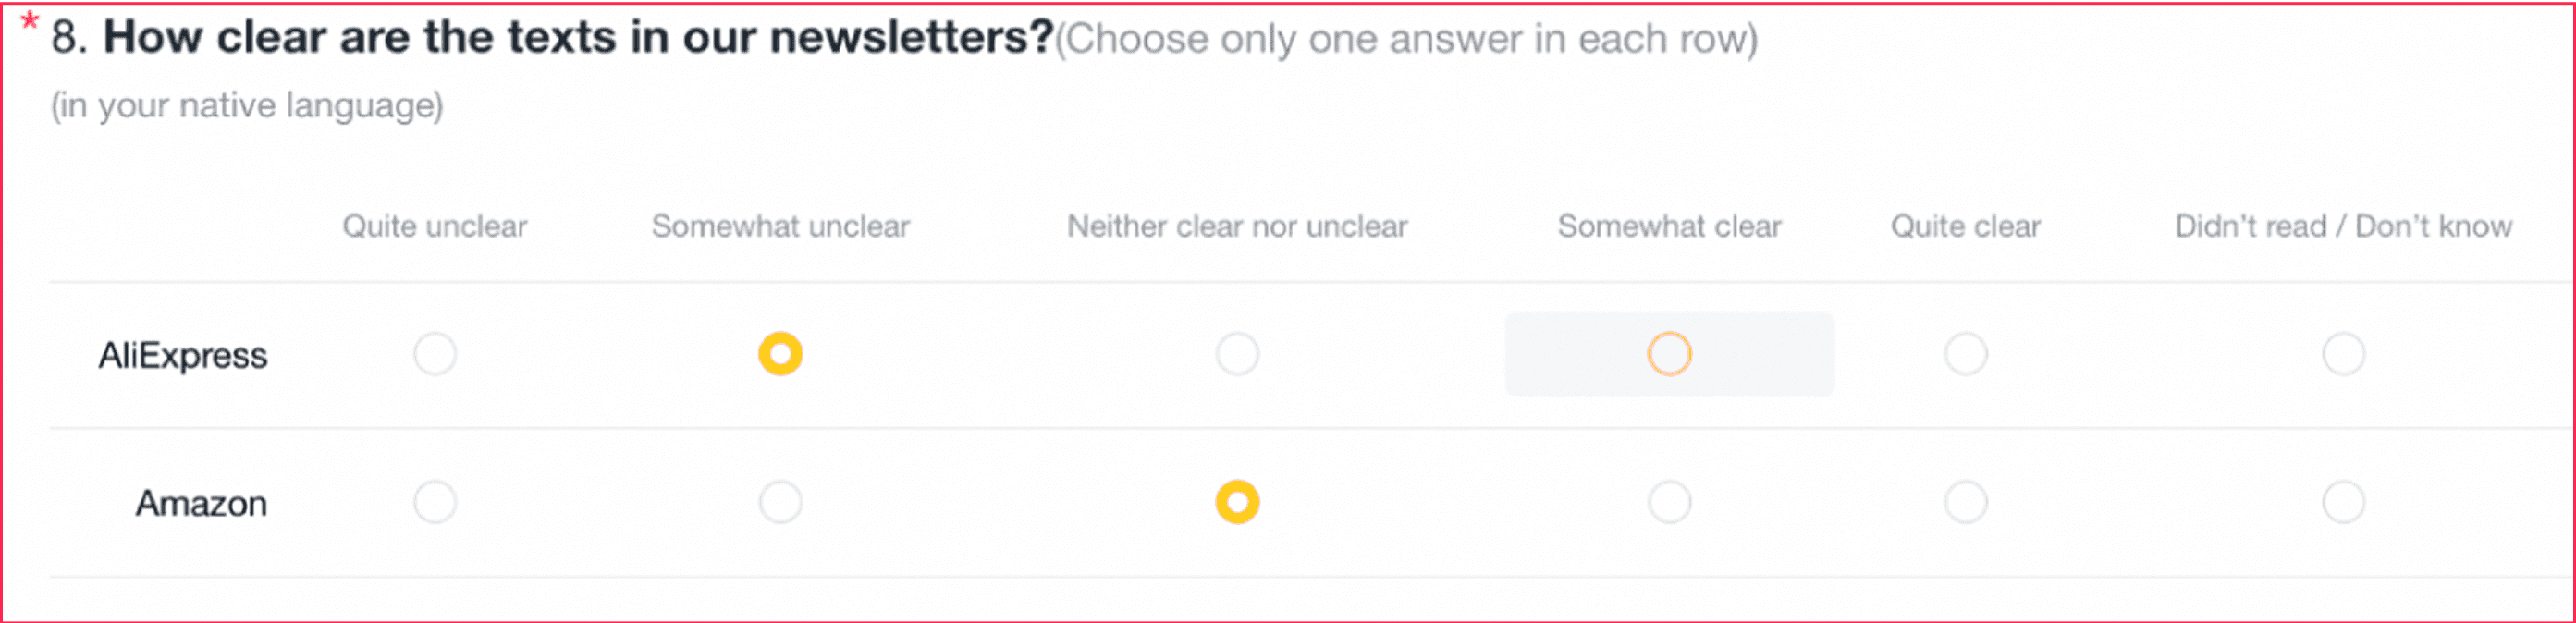
Before: 1.0 Sample Question
Before: 1.0 Sample Question
Before: 1.0 Sample Question

After: 2.0 Sample Question
After: 2.0 Sample Question
After: 2.0 Sample Question
B. Clear Scoring Criteria
B. Clear Scoring Criteria
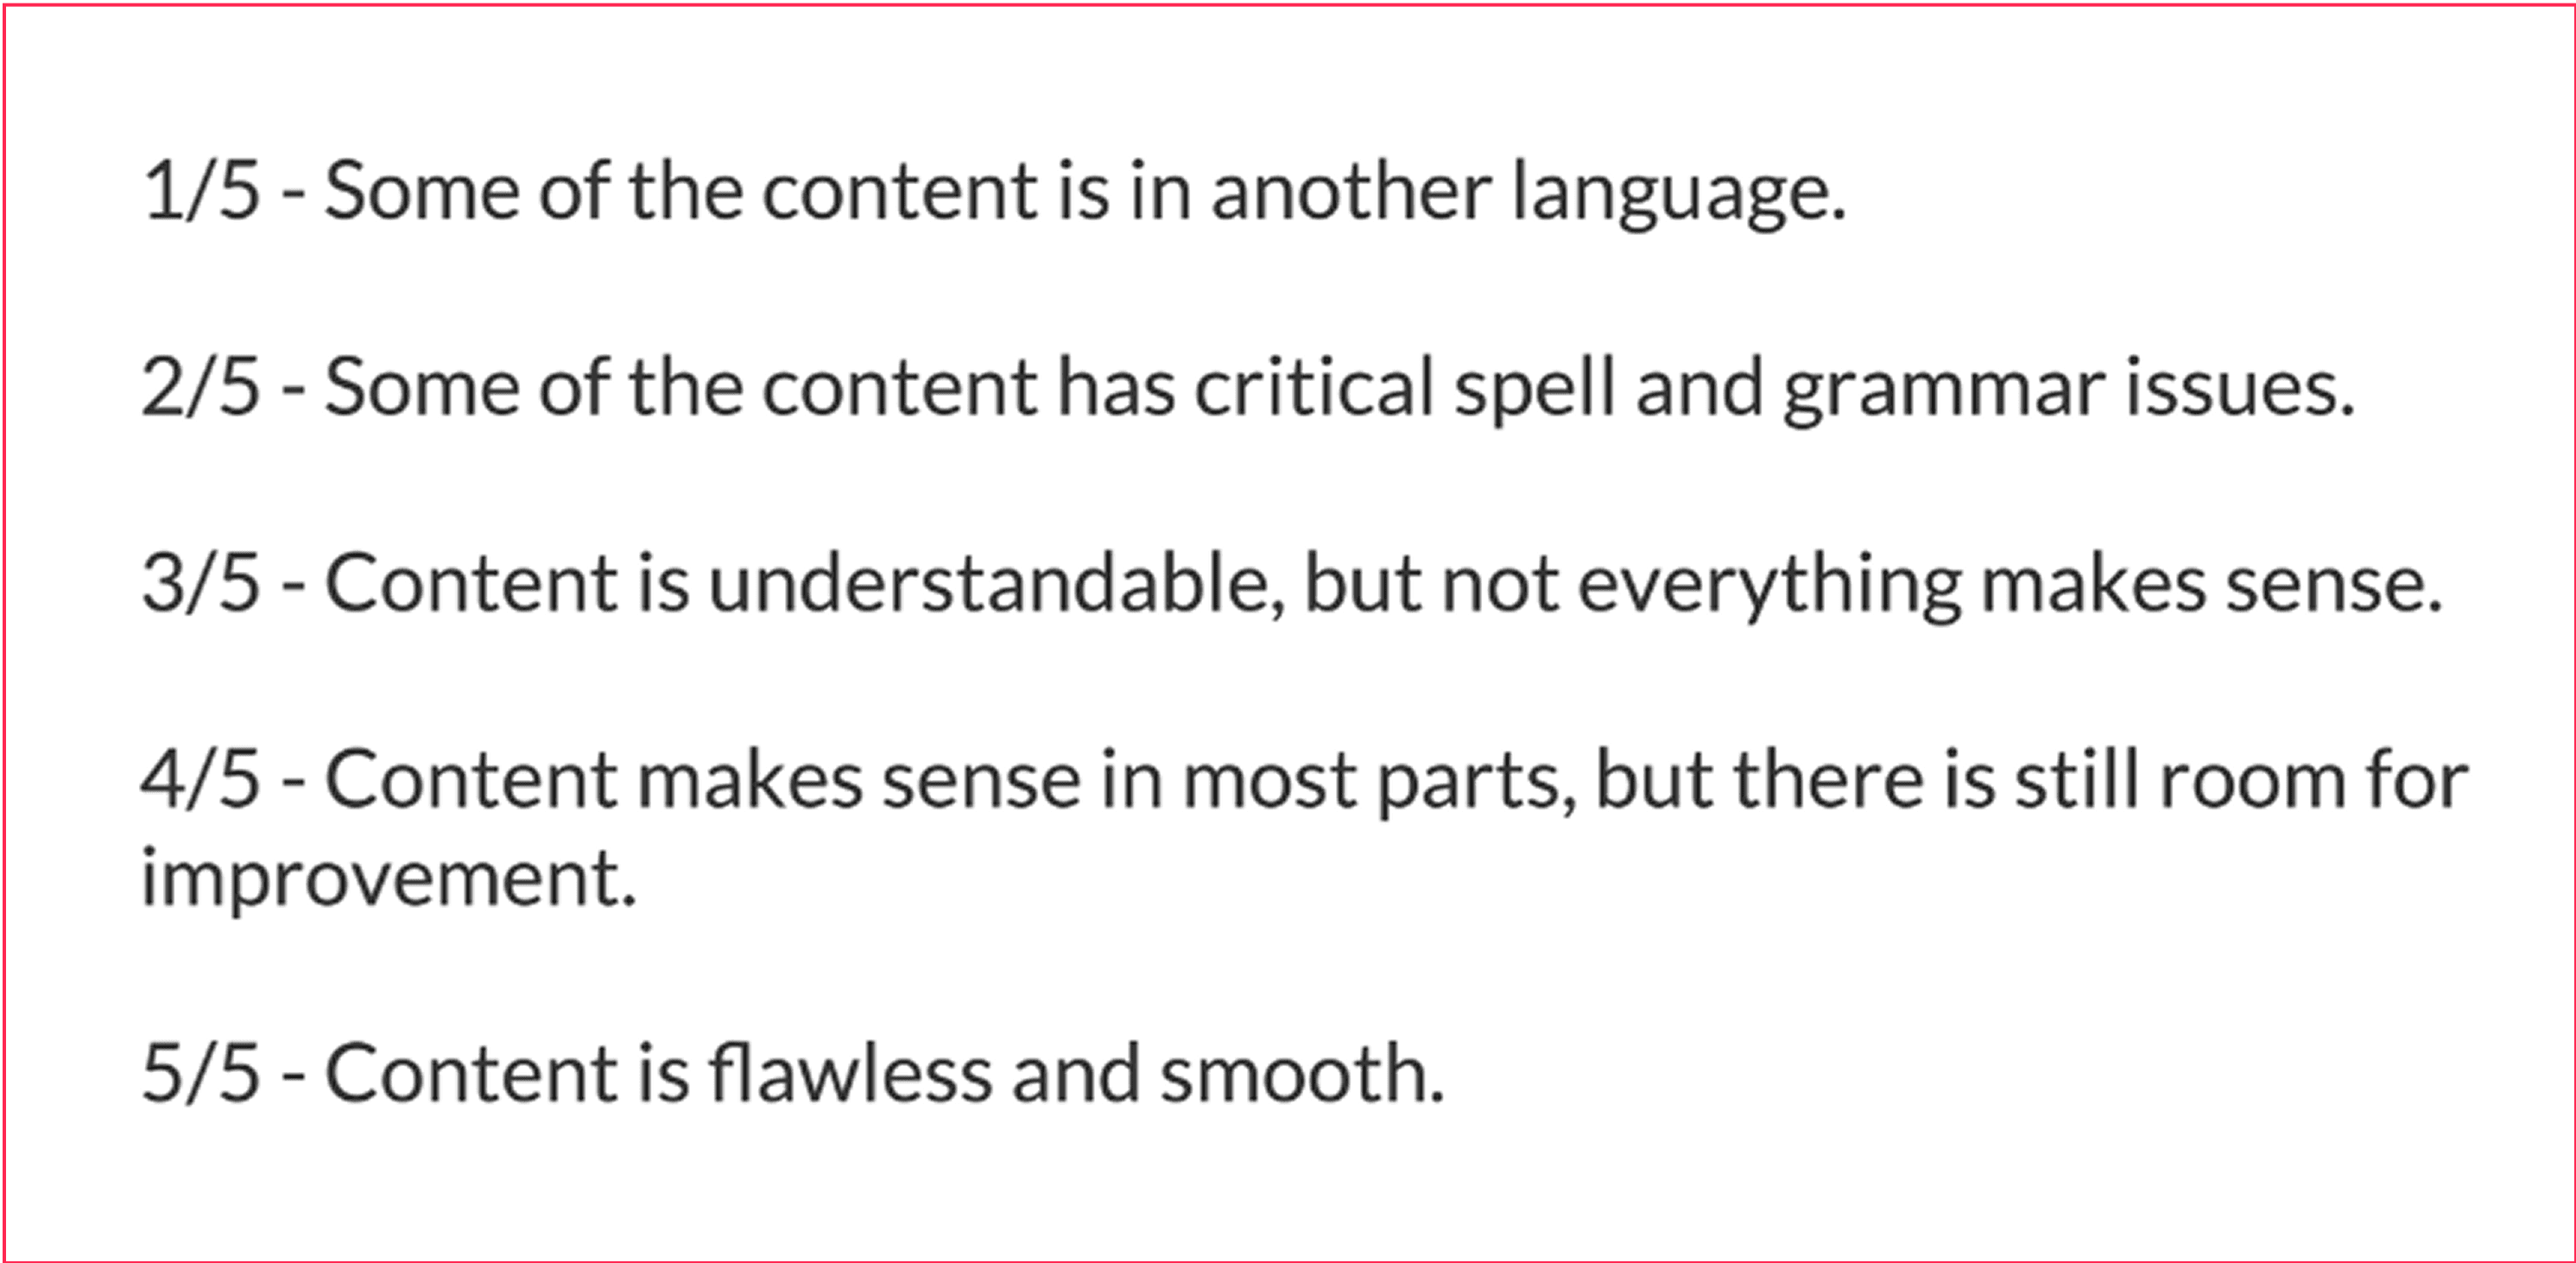
Adapted from our internal content QA framework, we added a 1–5 scale with explicit definitions above each screenshot, reducing subjective interpretation.
Adapted from our internal content QA framework, we added a 1–5 scale with explicit definitions above each screenshot, reducing subjective interpretation.
Adapted from our internal content QA framework, we added a 1–5 scale with explicit definitions above each screenshot, reducing subjective interpretation.
We also partnered with UX writers to ensure each scoring definition was appropriately localized, culturally relevant, and easy for users to understand without jargon or ambiguity.
We also partnered with UX writers to ensure each scoring definition was appropriately localized, culturally relevant, and easy for users to understand without jargon or ambiguity.
We also partnered with UX writers to ensure each scoring definition was appropriately localized, culturally relevant, and easy for users to understand without jargon or ambiguity.

Internal QA Pyramid Framework
Internal QA Pyramid Framework
Internal QA Pyramid Framework
Adapted Scale for External Users
Adapted Scale for External Users
Adapted Scale for External Users
C. Split Survey Delivery
C. Split Survey Delivery
For each market, AliExpress and competitor versions were sent separately to 2 different active user groups, limiting brand bias during evaluations.
For each market, AliExpress and competitor versions were sent separately to 2 different active user groups, limiting brand bias during evaluations.
For each market, AliExpress and competitor versions were sent separately to 2 different active user groups, limiting brand bias during evaluations.
VALIDATE & ITERATE
VALIDATE & ITERATE
VALIDATE & ITERATE
2.0 Addressing hidden issues to improve response fidelity
2.0 Addressing hidden issues to improve response fidelity
2.0 Addressing hidden issues to improve response fidelity
In April 2021, we launched the first revamped Gap Survey.
In April 2021, we launched the first revamped Gap Survey.
In April 2021, we launched the first revamped Gap Survey.
We observed clear improvements in score consistency, and results became more interpretable across most markets. However, an unexpected 115% relative increase in US Gap Pct raised a red flag and prompted us to investigate potential blind spots.
We observed clear improvements in score consistency, and results became more interpretable across most markets. However, an unexpected 115% relative increase in US Gap Pct raised a red flag and prompted us to investigate potential blind spots.
We observed clear improvements in score consistency, and results became more interpretable across most markets. However, an unexpected 115% relative increase in US Gap Pct raised a red flag and prompted us to investigate potential blind spots.
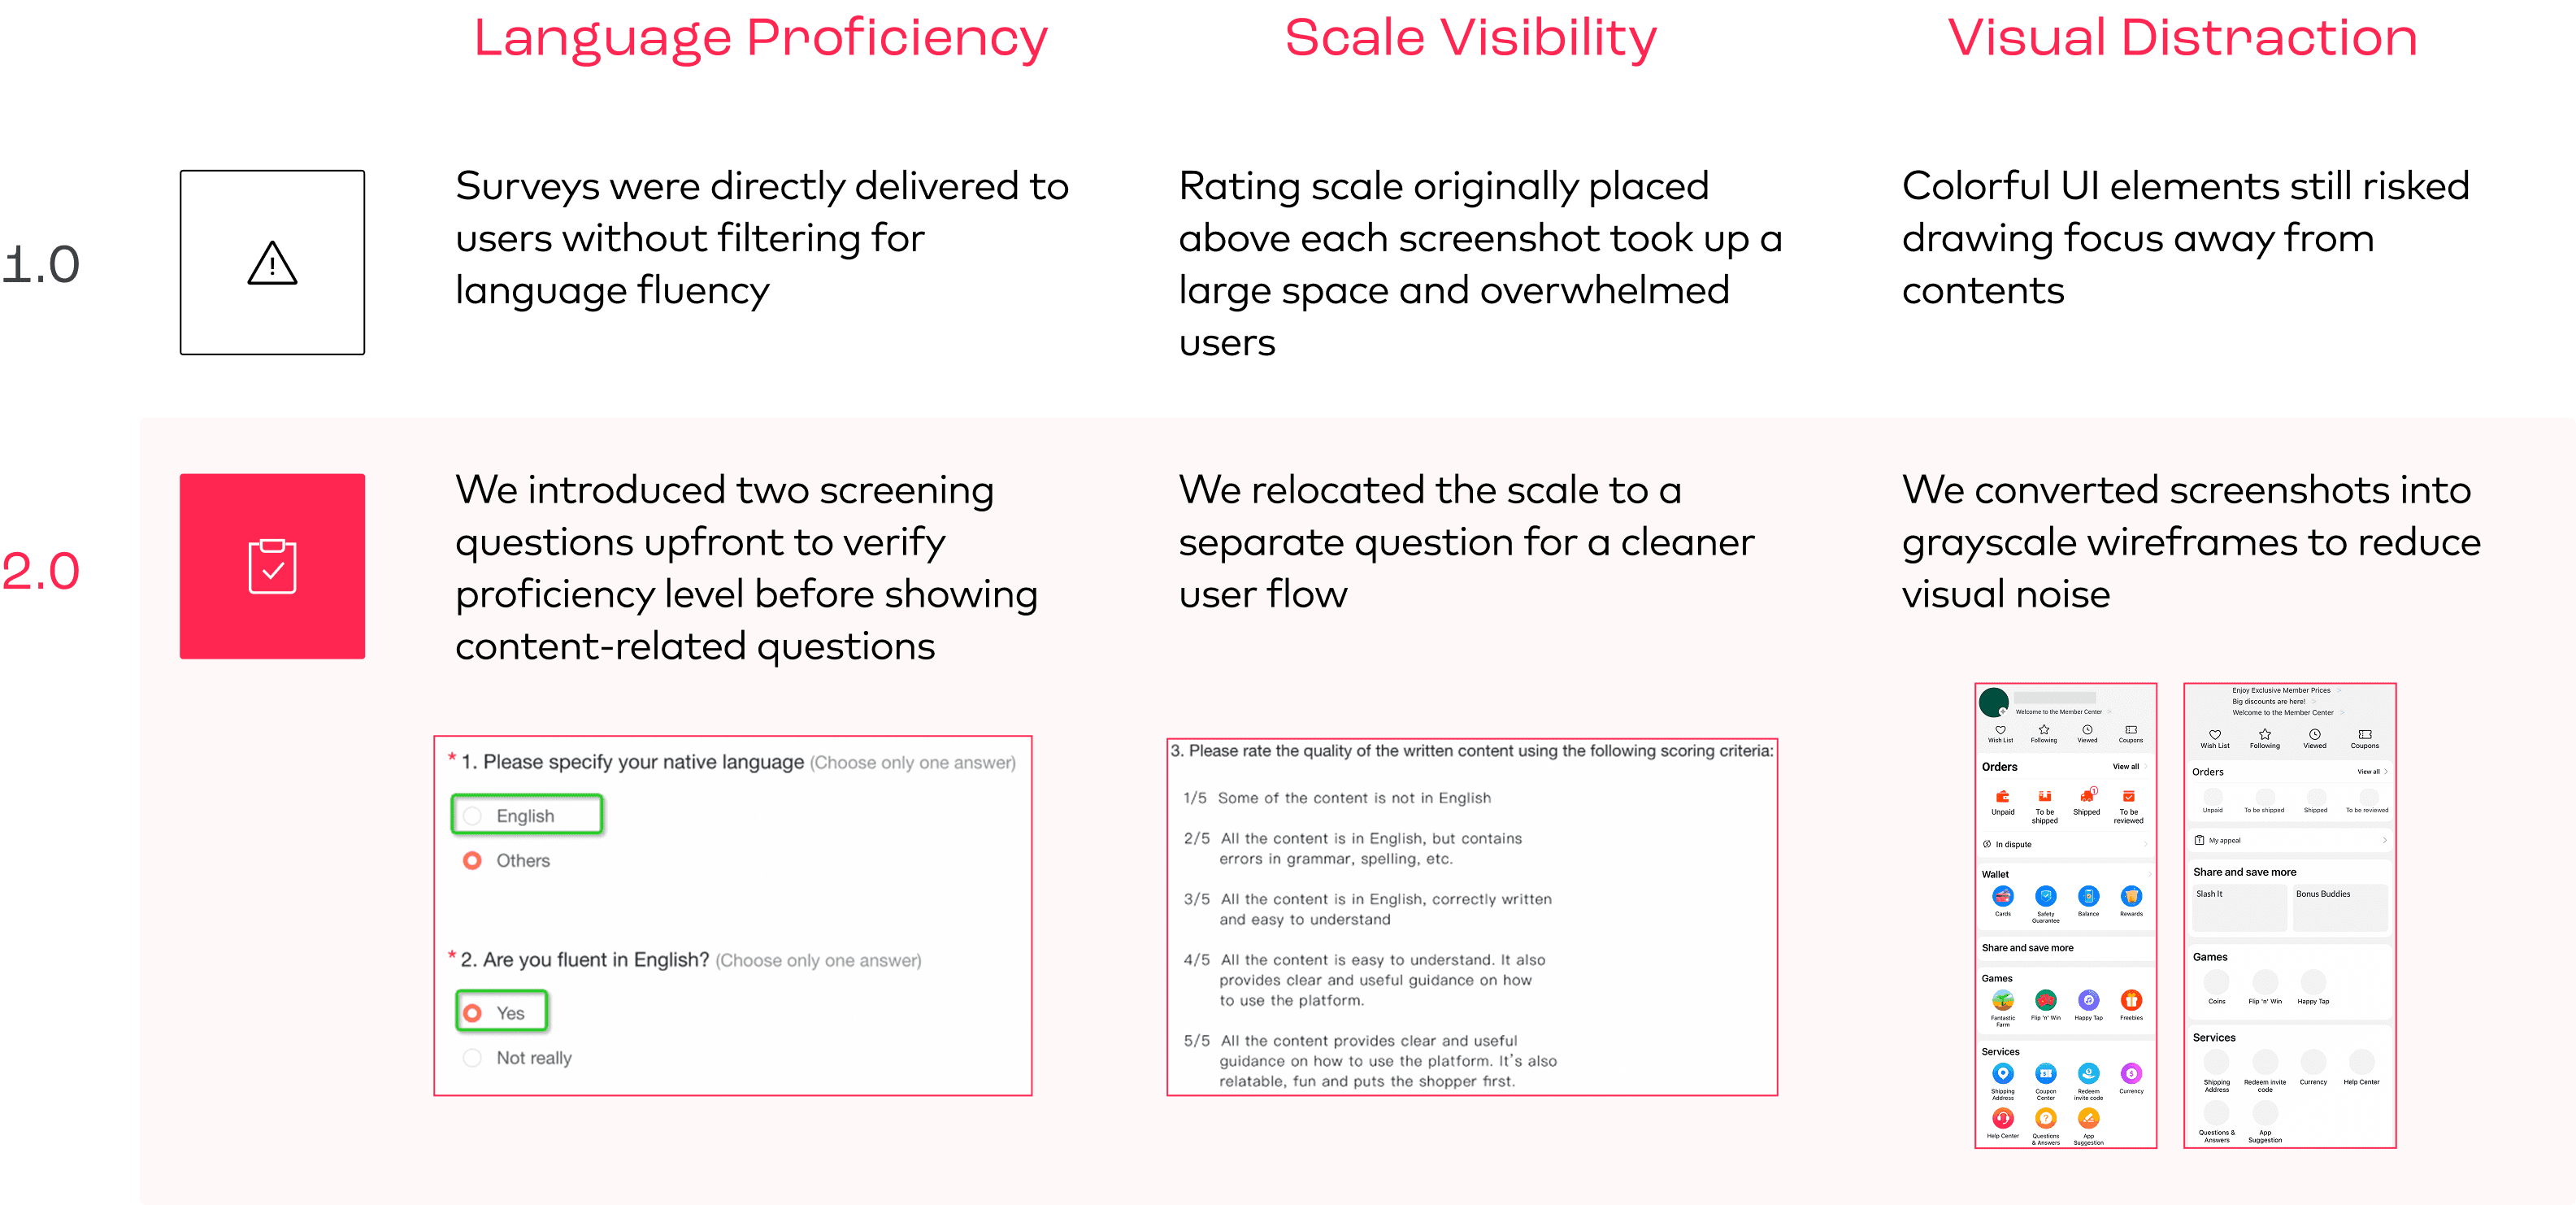
Response patterns revealed many users lacked sufficient English proficiency, and others misinterpreted the scoring criteria shown by mismatches between comments and ratings.
Response patterns revealed many users lacked sufficient English proficiency, and others misinterpreted the scoring criteria shown by mismatches between comments and ratings.
Response patterns revealed many users lacked sufficient English proficiency, and others misinterpreted the scoring criteria shown by mismatches between comments and ratings.
Combined with our hypotheses, we worked out solutions for three major issues:
Combined with our hypotheses, we worked out solutions for three major issues:
Combined with our hypotheses, we worked out solutions for three major issues:

STANDARDIZE & IMPLEMENT
STANDARDIZE & IMPLEMENT
STANDARDIZE & IMPLEMENT
3.0 Final polish to clean up data noise
3.0 Final polish to clean up data noise
3.0 Final polish to clean up data noise
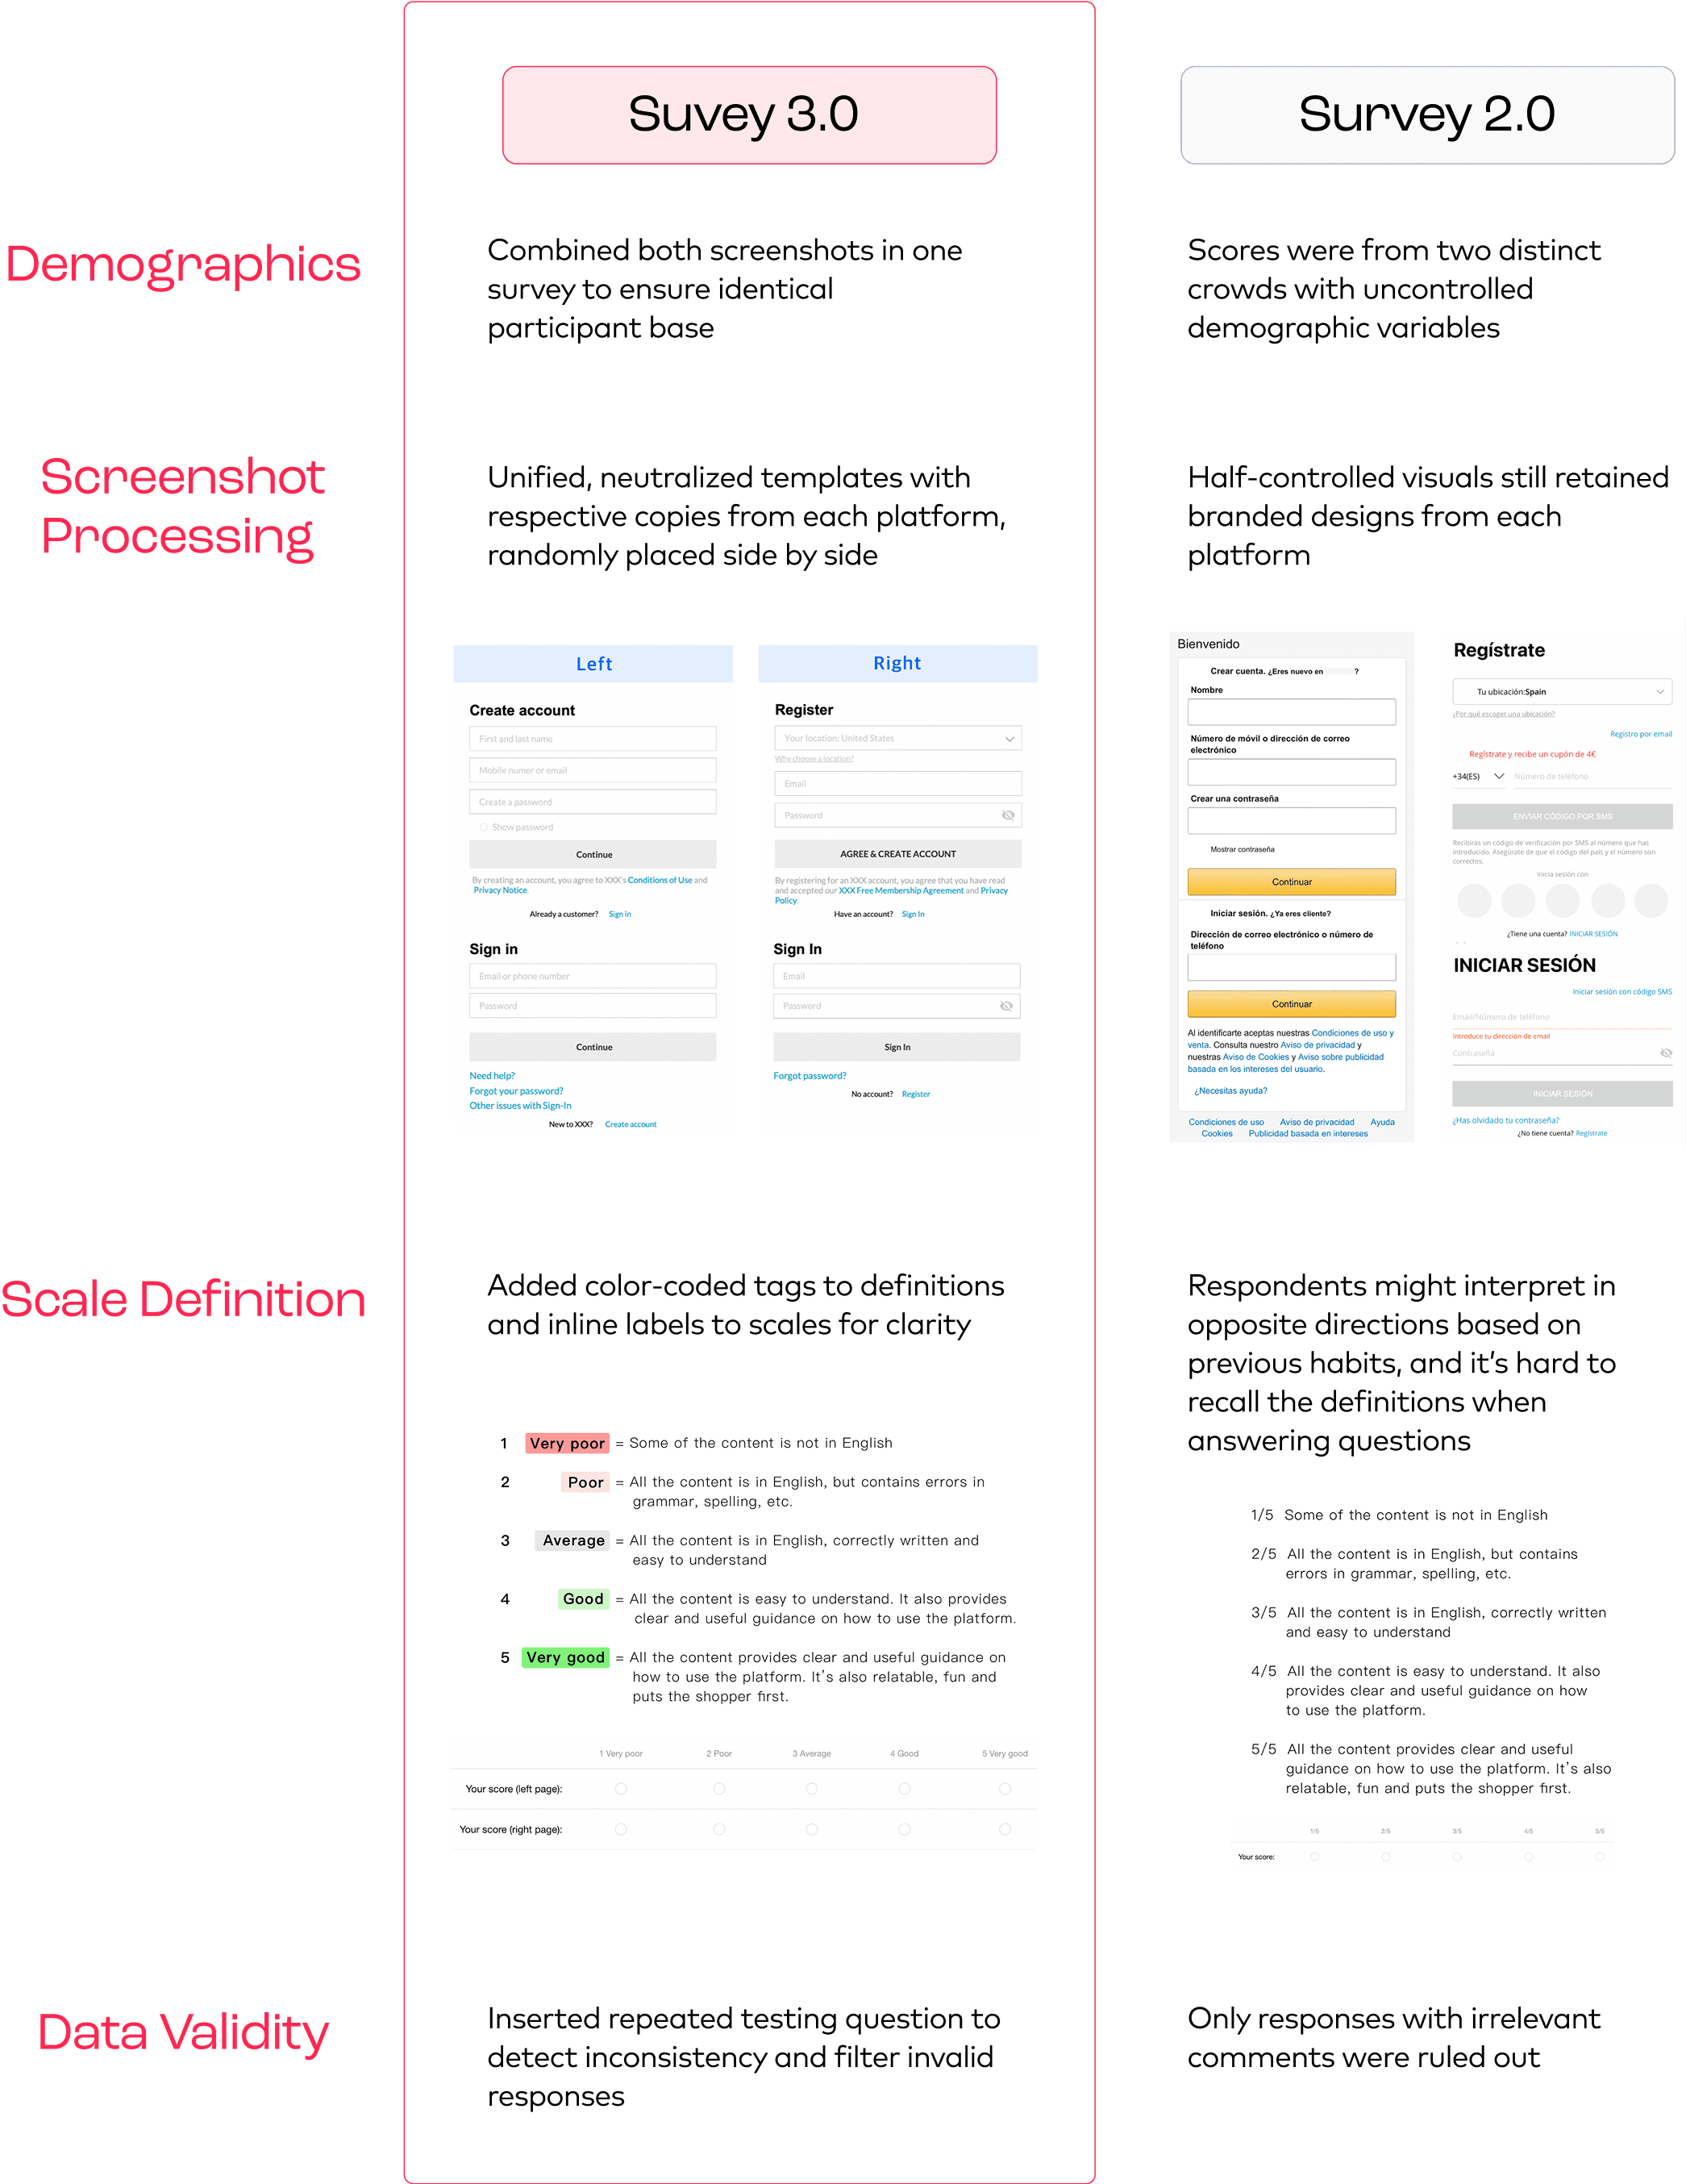
Version 2.0 brought noticeable improvements, yet post-launch analysis showed lingering issues of demographic noise, brand bias, lack of scale cues, etc.
Version 2.0 brought noticeable improvements, yet post-launch analysis showed lingering issues of demographic noise, brand bias, lack of scale cues, etc.
Version 2.0 brought noticeable improvements, yet post-launch analysis showed lingering issues of demographic noise, brand bias, lack of scale cues, etc.
3.0 addressed these with tighter controls to produce higher-confidence results.
3.0 addressed these with tighter controls to produce higher-confidence results.
3.0 addressed these with tighter controls to produce higher-confidence results.


Redesigned Survey Trends (Apr 2022 - Mar 2023)
Redesigned Survey Trends (Apr 2022 - Mar 2023)
Redesigned Survey Trends (Apr 2022 - Mar 2023)
The final iteration brought alignment between survey results and internal QA scores with the Gap (%) steadily improving from August 2022.
The final iteration brought alignment between survey results and internal QA scores with the Gap (%) steadily improving from August 2022.
The final iteration brought alignment between survey results and internal QA scores with the Gap (%) steadily improving from August 2022.
After standardization, only around 18% of responses were qualified as valid. With cleaner visuals and stricter data checks, the Gap Survey delivered more consistent, interpretable signals.
After standardization, only around 18% of responses were qualified as valid. With cleaner visuals and stricter data checks, the Gap Survey delivered more consistent, interpretable signals.
After standardization, only around 18% of responses were qualified as valid. With cleaner visuals and stricter data checks, the Gap Survey delivered more consistent, interpretable signals.
Takeaways
Takeaways
Takeaways
Surveys help gain valuable first-hand user feedback, and even smallest tweaks in their design can shift results significantly. Treating research methodology as a product/system to be tested & iterated on ensures insights are grounded and less biased.
Surveys help gain valuable first-hand user feedback, and even smallest tweaks in their design can shift results significantly. Treating research methodology as a product/system to be tested & iterated on ensures insights are grounded and less biased.
Surveys help gain valuable first-hand user feedback, and even smallest tweaks in their design can shift results significantly. Treating research methodology as a product/system to be tested & iterated on ensures insights are grounded and less biased.
Moving forward, the survey methodology requires continuous validation to remain a credible source, as well as adaptation to evolving user needs and business goals.
Moving forward, the survey methodology requires continuous validation to remain a credible source, as well as adaptation to evolving user needs and business goals.
Moving forward, the survey methodology requires continuous validation to remain a credible source, as well as adaptation to evolving user needs and business goals.
Next Up


Next Up
Next Up
I'm just a message away! 🙌
I'm just a message away! 🙌
I'm just a message away! 🙌
